HDF5 in Python with h5py
One way to gain a quick familiarity with NeXus is to start working with some data. For at least the
first few examples in this section, we have a simple two-column set of 1-D data, collected as part of a
series of alignment scans by the APS USAXS instrument during the time it was stationed at
beam line 32ID. We will show how to write this
data using the Python language and the h5py package [1]
(using h5py calls directly rather than using the NeXus NAPI). The
actual data to be written was extracted (elsewhere) from a spec [2] data file
and read as a text block from a file by the Python source code.
Our examples will start with the simplest case and add only mild complexity with each new case
since these examples are meant for those who are unfamiliar with NeXus.
Code examples
Example data used
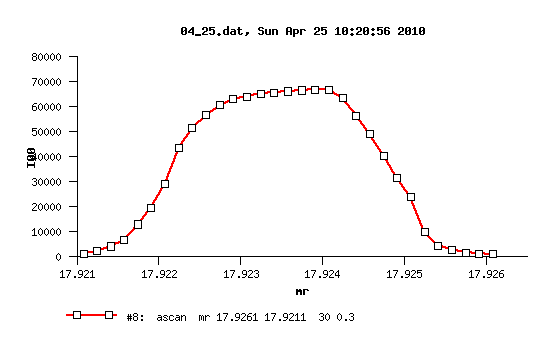
The data shown plotted in the next figure will be written to the NeXus HDF5 file
using only two NeXus base classes, NXentry and NXdata, in the first example
and then minor variations on this structure in the next two examples. The
data model is identical to the one in the Introduction
chapter except that the names will be different, as shown below:

data structure of the simple example
1/entry:NXentry
2    /mr_scan:NXdata
3       /mr : float64[31]
4       /I00 : int32[31]

plot of the simple example data
Simple example values
 117.92608    1037
 217.92591    1318
 317.92575    1704
 417.92558    2857
 517.92541    4516
 617.92525    9998
 717.92508    23819
 817.92491    31662
 917.92475    40458
1017.92458    49087
1117.92441    56514
1217.92425    63499
1317.92408    66802
1417.92391    66863
1517.92375    66599
1617.92358    66206
1717.92341    65747
1817.92325    65250
1917.92308    64129
2017.92291    63044
2117.92275    60796
2217.92258    56795
2317.92241    51550
2417.92225    43710
2517.92208    29315
2617.92191    19782
2717.92175    12992
2817.92158    6622
2917.92141    4198
3017.92125    2248
3117.92108    1321
