Python Examples using h5py
One way to gain a quick familiarity with NeXus is to start working with some data. For at least the
first few examples in this section, we have a simple two-column set of 1-D data, collected as part of a
series of alignment scans by the APS USAXS instrument during the time it was stationed at
beam line 32ID. We will show how to write this
data using the Python language and the h5py package 1
(using h5py calls directly rather than using the NeXus NAPI). The
actual data to be written was extracted (elsewhere) from a spec 2 data file
and read as a text block from a file by the Python source code.
Our examples will start with the simplest case and add only mild complexity with each new case
since these examples are meant for those who are unfamiliar with NeXus.
- 1
h5py: https://www.h5py.org/
- 2
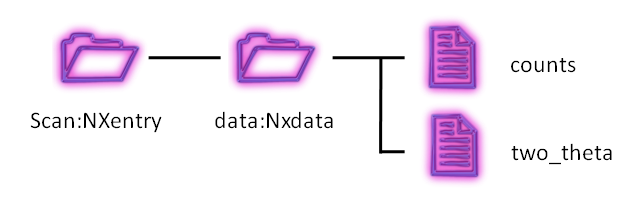
The data shown plotted in the next figure will be written to the NeXus HDF5 file
using only two NeXus base classes, NXentry and NXdata, in the first example
and then minor variations on this structure in the next two examples. The
data model is identical to the one in the Introduction
chapter except that the names will be different, as shown below:
data structure, (from Introduction)
our h5py example
1/entry:NXentry
2    /mr_scan:NXdata
3       /mr : float64[31]
4       /I00 : int32[31]
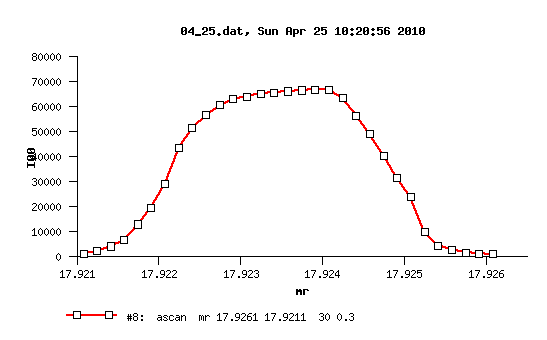
plot of our mr_scan
two-column data for our mr_scan
 117.92608    1037
 217.92591    1318
 317.92575    1704
 417.92558    2857
 517.92541    4516
 617.92525    9998
 717.92508    23819
 817.92491    31662
 917.92475    40458
1017.92458    49087
1117.92441    56514
1217.92425    63499
1317.92408    66802
1417.92391    66863
1517.92375    66599
1617.92358    66206
1717.92341    65747
1817.92325    65250
1917.92308    64129
2017.92291    63044
2117.92275    60796
2217.92258    56795
2317.92241    51550
2417.92225    43710
2517.92208    29315
2617.92191    19782
2717.92175    12992
2817.92158    6622
2917.92141    4198
3017.92125    2248
3117.92108    1321
Writing the simplest data using h5py
These two examples show how to write the simplest data (above).
One example writes the data directly to the NXdata group
while the other example writes the data to NXinstrument/NXdetector/data
and then creates a soft link to that data in NXdata.
Complete h5py example writing and reading a NeXus data file
Writing the HDF5 file using h5py
In the main code section of BasicWriter.py,
a current time stamp
is written in the format of ISO 8601 (yyyy-mm-ddTHH:MM:SS).
For simplicity of this code example, we use a text string for the time, rather than
computing it directly from Python support library calls. It is easier this way to
see the exact type of string formatting for the time. When using the Python
datetime package, one way to write the time stamp is:
1timestamp = "T".join( str( datetime.datetime.now() ).split() )
The data (mr is similar to “two_theta” and
I00 is similar to “counts”) is collated into two Python lists. We use the
numpy package to read the file and parse the two-column format.
The new HDF5 file is opened (and created if not already existing) for writing,
setting common NeXus attributes in the same command from our support library.
Proper HDF5+NeXus groups are created for /entry:NXentry/mr_scan:NXdata.
Since we are not using the NAPI, our
support library must create and set the NX_class attribute on each group.
Note
We want to create the desired structure of
/entry:NXentry/mr_scan:NXdata/.
First, our support library calls
f = h5py.File()to create the file and root level NeXus structure.Then, it calls
nxentry = f.create_group("entry")to create theNXentrygroup calledentryat the root level.Then, it calls
nxdata = nxentry.create_group("mr_scan")to create theNXentrygroup calledentryas a child of theNXentrygroup.
Next, we create a dataset called title to hold a title string that can
appear on the default plot.
Next, we create datasets for mr and I00 using our support library.
The data type of each, as represented in numpy, will be recognized by
h5py and automatically converted to the proper HDF5 type in the file.
A Python dictionary of attributes is given, specifying the engineering units and other
values needed by NeXus to provide a default plot of this data. By setting signal="I00"
as an attribute on the group, NeXus recognizes I00 as the default
y axis for the plot. The axes="mr" attribute on the NXdata
group connects the dataset to be used as the x axis.
Finally, we must remember to call f.close() or we might
corrupt the file when the program quits.
BasicWriter.py: Write a NeXus HDF5 file using Python with h5py
 1#!/usr/bin/env python
 2'''Writes a NeXus HDF5 file using h5py and numpy'''
 3
 4import h5py    # HDF5 support
 5import numpy
 6import six
 7
 8print("Write a NeXus HDF5 file")
 9fileName = u"prj_test.nexus.hdf5"
10timestamp = u"2010-10-18T17:17:04-0500"
11
12# load data from two column format
13data = numpy.loadtxt(u"input.dat").T
14mr_arr = data[0]
15i00_arr = numpy.asarray(data[1],'int32')
16
17# create the HDF5 NeXus file
18f = h5py.File(fileName, "w")
19# point to the default data to be plotted
20f.attrs[u'default']          = u'entry'
21# give the HDF5 root some more attributes
22f.attrs[u'file_name']        = fileName
23f.attrs[u'file_time']        = timestamp
24f.attrs[u'instrument']       = u'APS USAXS at 32ID-B'
25f.attrs[u'creator']          = u'BasicWriter.py'
26f.attrs[u'NeXus_version']    = u'4.3.0'
27f.attrs[u'HDF5_Version']     = six.u(h5py.version.hdf5_version)
28f.attrs[u'h5py_version']     = six.u(h5py.version.version)
29
30# create the NXentry group
31nxentry = f.create_group(u'entry')
32nxentry.attrs[u'NX_class'] = u'NXentry'
33nxentry.attrs[u'default'] = u'mr_scan'
34nxentry.create_dataset(u'title', data=u'1-D scan of I00 v. mr')
35
36# create the NXentry group
37nxdata = nxentry.create_group(u'mr_scan')
38nxdata.attrs[u'NX_class'] = u'NXdata'
39nxdata.attrs[u'signal'] = u'I00'      # Y axis of default plot
40nxdata.attrs[u'axes'] = u'mr'         # X axis of default plot
41nxdata.attrs[u'mr_indices'] = [0,]   # use "mr" as the first dimension of I00
42
43# X axis data
44ds = nxdata.create_dataset(u'mr', data=mr_arr)
45ds.attrs[u'units'] = u'degrees'
46ds.attrs[u'long_name'] = u'USAXS mr (degrees)'    # suggested X axis plot label
47
48# Y axis data
49ds = nxdata.create_dataset(u'I00', data=i00_arr)
50ds.attrs[u'units'] = u'counts'
51ds.attrs[u'long_name'] = u'USAXS I00 (counts)'    # suggested Y axis plot label
52
53f.close()   # be CERTAIN to close the file
54
55print("wrote file:", fileName)
Reading the HDF5 file using h5py
The file reader, BasicReader.py,
is very simple since the bulk of the work is done by h5py.
Our code opens the HDF5 we wrote above,
prints the HDF5 attributes from the file, reads the two datasets,
and then prints them out as columns. As simple as that.
Of course, real code might add some error-handling and
extracting other useful stuff from the file.
Note
See that we identified each of the two datasets using HDF5 absolute path references
(just using the group and dataset names). Also, while coding this example, we were reminded
that HDF5 is sensitive to upper or lowercase. That is, I00 is not the same is
i00.
BasicReader.py: Read a NeXus HDF5 file using Python with h5py
 1#!/usr/bin/env python
 2'''Reads NeXus HDF5 files using h5py and prints the contents'''
 3
 4import h5py    # HDF5 support
 5
 6fileName = "prj_test.nexus.hdf5"
 7f = h5py.File(fileName,  "r")
 8for item in f.attrs.keys():
 9    print(item + ":", f.attrs[item])
10mr = f['/entry/mr_scan/mr']
11i00 = f['/entry/mr_scan/I00']
12print("%s\t%s\t%s" % ("#", "mr", "I00"))
13for i in range(len(mr)):
14    print("%d\t%g\t%d" % (i, mr[i], i00[i]))
15f.close()
Output from BasicReader.py is shown next.
Output from BasicReader.py
 1file_name: prj_test.nexus.hdf5
 2file_time: 2010-10-18T17:17:04-0500
 3creator: BasicWriter.py
 4HDF5_Version: 1.8.5
 5NeXus_version: 4.3.0
 6h5py_version: 1.2.1
 7instrument: APS USAXS at 32ID-B
 8#   mr  I00
 90   17.9261 1037
101   17.9259 1318
112   17.9258 1704
123   17.9256 2857
134   17.9254 4516
145   17.9252 9998
156   17.9251 23819
167   17.9249 31662
178   17.9247 40458
189   17.9246 49087
1910  17.9244 56514
2011  17.9243 63499
2112  17.9241 66802
2213  17.9239 66863
2314  17.9237 66599
2415  17.9236 66206
2516  17.9234 65747
2617  17.9232 65250
2718  17.9231 64129
2819  17.9229 63044
2920  17.9228 60796
3021  17.9226 56795
3122  17.9224 51550
3223  17.9222 43710
3324  17.9221 29315
3425  17.9219 19782
3526  17.9217 12992
3627  17.9216 6622
3728  17.9214 4198
3829  17.9213 2248
3930  17.9211 1321
Finding the default plottable data
Let’s make a new reader that follows the chain of
attributes (@default, @signal, and @axes)
to find the default plottable data. We’ll use the
same data file as the previous example.
Our demo here assumes one-dimensional data.
(For higher dimensionality data,
we’ll need more complexity when handling the
@axes attribute and we’ll to check the
field sizes. See section Find the plottable data,
subsection Version 3, for the details.)
reader_attributes_trail.py: Read a NeXus HDF5 file using Python with h5py
 1
 2import h5py
 3
 4with h5py.File("prj_test.nexus.hdf5", "r") as nx:
 5    # find the default NXentry group
 6    nx_entry = nx[nx.attrs["default"]]
 7    # find the default NXdata group
 8    nx_data = nx_entry[nx_entry.attrs["default"]]
 9    # find the signal field
10    signal = nx_data[nx_data.attrs["signal"]]
11    # find the axes field(s)
12    attr_axes = nx_data.attrs["axes"]
13    if isinstance(attr_axes, (set, tuple, list)):
14        #  but check that attr_axes only describes 1-D data
15        if len(attr_axes) == 1:
16            attr_axes = attr_axes[0]
17        else:
18            raise ValueError(f"expected 1-D data but @axes={attr_axes}")
19    axes = nx_data[attr_axes]
20
21    print(f"file: {nx.filename}")
22    print(f"signal: {signal.name}")
23    print(f"axes: {axes.name}")
24    print(f"{axes.name} {signal.name}")
25    for x, y in zip(axes, signal):
26        print(x, y)
Output from reader_attributes_trail.py is shown next.
Output from reader_attributes_trail.py
 1file: prj_test.nexus.hdf5
 2signal: /entry/mr_scan/I00
 3axes: /entry/mr_scan/mr
 4/entry/mr_scan/mr /entry/mr_scan/I00
 517.92608 1037
 617.92591 1318
 717.92575 1704
 817.92558 2857
 917.92541 4516
1017.92525 9998
1117.92508 23819
1217.92491 31662
1317.92475 40458
1417.92458 49087
1517.92441 56514
1617.92425 63499
1717.92408 66802
1817.92391 66863
1917.92375 66599
2017.92358 66206
2117.92341 65747
2217.92325 65250
2317.92308 64129
2417.92291 63044
2517.92275 60796
2617.92258 56795
2717.92241 51550
2817.92225 43710
2917.92208 29315
3017.92191 19782
3117.92175 12992
3217.92158 6622
3317.92141 4198
3417.92125 2248
3517.92108 1321
Plotting the HDF5 file
Now that we are certain our file conforms to the NeXus
standard, let’s plot it using the NeXpy 3
client tool. To help label the plot, we added the
long_name attributes to each of our datasets.
We also added metadata to the root level of our HDF5 file
similar to that written by the NAPI. It seemed to be a useful addition.
Compare this with plot of our mr_scan
and note that the horizontal axis of this plot is mirrored from that above.
This is because the data is stored in the file in descending
mr order and NeXpy has plotted
it that way (in order of appearance) by default.
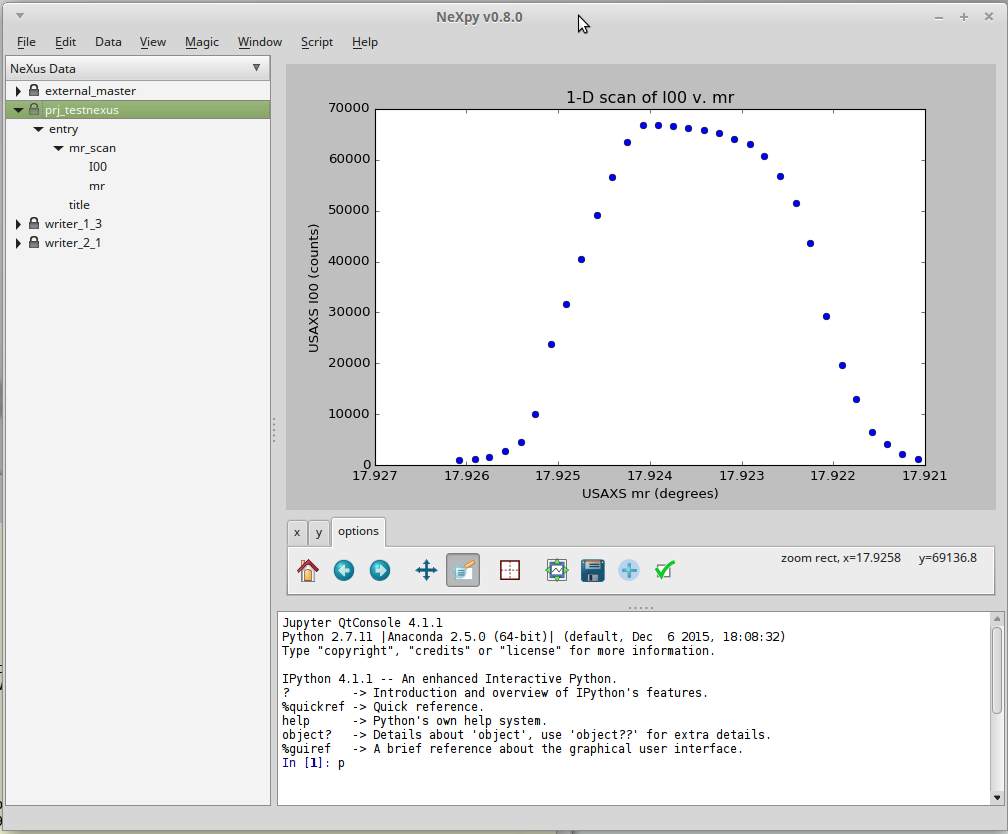
plot of our mr_scan using NeXpy
Links to Data in External HDF5 Files
HDF5 files may contain links to data (or groups) in other files.
This can be used to advantage to refer to data in existing HDF5 files
and create NeXus-compliant data files. Here, we show such an example,
using the same counts v. two_theta data from the examples above.
We use the HDF5 external file links with NeXus data files.
f[local_addr] = h5py.ExternalLink(external_file_name, external_addr)
where f is an open h5py.File() object in which we will create the new link,
local_addr is an HDF5 path address, external_file_name is the name
(relative or absolute) of an existing HDF5 file, and external_addr is the
HDF5 path address of the existing data in the external_file_name to be linked.
file: external_angles.hdf5
Take for example, the structure of external_angles.hdf5,
a simple HDF5 data file that contains just the two_theta
angles in an HDF5 dataset at the root level of the file.
Although this is a valid HDF5 data file, it is not a valid NeXus data file:
1angles:float64[31] = [17.926079999999999, '...', 17.92108]
2  @units = degrees
file: external_counts.hdf5
The data in the file external_angles.hdf5 might be referenced from
another HDF5 file (such as external_counts.hdf5)
by an HDF5 external link. 4
Here is an example of the structure:
1entry:NXentry
2  instrument:NXinstrument
3  detector:NXdetector
4    counts:NX_INT32[31] = [1037, '...', 1321]
5      @units = counts
6    two_theta --> file="external_angles.hdf5", path="/angles"
- 4
see these URLs for further guidance on HDF5 external links: https://portal.hdfgroup.org/display/HDF5/H5L_CREATE_EXTERNAL, http://docs.h5py.org/en/stable/high/group.html#external-links
file: external_master.hdf5
A valid NeXus data file could be created that refers to the data in these files without making a copy of the data files themselves.
Note
It is necessary for all these files to be located together in the same directory for the HDF5 external file links to work properly.`
To be a valid NeXus file, it must contain a NXentry group. For the files above, it is simple to make a master file that links to the data we desire, from structure that we create. We then add the group attributes that describe the default plottable data:
data:NXdata
  @signal = counts
  @axes = "two_theta"
  @two_theta_indices = 0
Here is (the basic structure of) external_master.hdf5, an example:
1entry:NXentry
2@default = data
3  instrument --> file="external_counts.hdf5", path="/entry/instrument"
4  data:NXdata
5    @signal = counts
6    @axes = "two_theta"
7     @two_theta = 0
8    counts --> file="external_counts.hdf5", path="/entry/instrument/detector/counts"
9    two_theta --> file="external_angles.hdf5", path="/angles"
source code: externalExample.py
Here is the complete code of a Python program, using h5py
to write a NeXus-compliant HDF5 file with links to data in other HDF5 files.
externalExample.py: Write using HDF5 external links
 1#!/usr/bin/env python
 2'''
 3Writes a NeXus HDF5 file using h5py with links to data in other HDF5 files.
 4
 5This example is based on ``writer_2_1``.
 6'''
 7
 8import h5py
 9import numpy
10
11FILE_HDF5_MASTER = u"external_master.hdf5"
12FILE_HDF5_ANGLES = u"external_angles.hdf5"
13FILE_HDF5_COUNTS = u"external_counts.hdf5"
14
15#---------------------------
16
17# get some data
18buffer = numpy.loadtxt("input.dat").T
19tthData = buffer[0]                             # float[]
20countsData = numpy.asarray(buffer[1],'int32')   # int[]
21
22# put the angle data in an external (non-NeXus) HDF5 data file
23f = h5py.File(FILE_HDF5_ANGLES, "w")
24ds = f.create_dataset(u"angles", data=tthData)
25ds.attrs[u"units"] = u"degrees"
26f.close()    # be CERTAIN to close the file
27
28
29# put the detector counts in an external HDF5 data file
30# with *incomplete* NeXus structure (no NXdata group)
31f = h5py.File(FILE_HDF5_COUNTS, "w")
32nxentry = f.create_group(u"entry")
33nxentry.attrs[u"NX_class"] = u"NXentry"
34nxinstrument = nxentry.create_group(u"instrument")
35nxinstrument.attrs[u"NX_class"] = u"NXinstrument"
36nxdetector = nxinstrument.create_group(u"detector")
37nxdetector.attrs[u"NX_class"] = u"NXdetector"
38ds = nxdetector.create_dataset(u"counts", data=countsData)
39ds.attrs[u"units"] = u"counts"
40# link the "two_theta" data stored in separate file
41local_addr = nxdetector.name + u"/two_theta"
42f[local_addr] = h5py.ExternalLink(FILE_HDF5_ANGLES, u"/angles")
43f.close()
44
45# create a master NeXus HDF5 file
46f = h5py.File(FILE_HDF5_MASTER, "w")
47f.attrs[u"default"] = u"entry"
48nxentry = f.create_group(u"entry")
49nxentry.attrs[u"NX_class"] =u"NXentry"
50nxentry.attrs[u"default"] = u"data"
51nxdata = nxentry.create_group(u"data")
52nxdata.attrs[u"NX_class"] = u"NXdata"
53
54# link in the signal data
55local_addr = '/entry/data/counts'
56external_addr = u"/entry/instrument/detector/counts"
57f[local_addr] = h5py.ExternalLink(FILE_HDF5_COUNTS, external_addr)
58nxdata.attrs[u"signal"] = u"counts"
59
60# link in the axes data
61local_addr = u"/entry/data/two_theta"
62f[local_addr] = h5py.ExternalLink(FILE_HDF5_ANGLES, u"/angles")
63nxdata.attrs[u"axes"] = u"two_theta"
64nxdata.attrs[u"two_theta_indices"] = [0,]
65
66local_addr = u"/entry/instrument"
67f[local_addr] = h5py.ExternalLink(FILE_HDF5_COUNTS, u"/entry/instrument")
68
69f.close()
downloads
The Python code and files related to this section may be downloaded from the following table.
file |
description |
|---|---|
2-column ASCII data used in this section |
|
python code to read example prj_test.nexus.hdf5 |
|
python code to write example prj_test.nexus.hdf5 |
|
h5dump analysis of external_angles.hdf5 |
|
HDF5 file written by externalExample |
|
punx tree analysis of external_angles.hdf5 |
|
h5dump analysis of external_counts.hdf5 |
|
HDF5 file written by externalExample |
|
punx tree analysis of external_counts.hdf5 |
|
python code to write external linking examples |
|
h5dump analysis of external_master.hdf5 |
|
NeXus file written by externalExample |
|
punx tree analysis of external_master.hdf5 |
|
h5dump analysis of the NeXus file |
|
NeXus file written by BasicWriter |
|
punx tree analysis of the NeXus file |